Send a slack message when NGINX is down
In the previous tutorial, we saw how to install prometheus and use the prometheus expression browser to view scraped ngind_up metrics. In this tutorial, we are actually going to create an alert that will send us a slack message when NGINX is down.
How to identify NGINX is down?
In the existing setup, Prometheus is scraping NGINX stub_status metrics with the help of nginx-prometheus-exporter. We are going to disable stub_status module temporarily to create a mock situation of NGINX being down (We could stop NGINX service directly, but we don't want to bring down our live site). Following stanza in your NGINX config enables stub_status module as shown in the previous tutorial
server {
    location = /basic_status {
        stub_status;
        allow 127.0.0.1; #only allow requests from localhost
        deny all;       #deny all other hosts
    }
    listen 81;
}
Comment out allow statement, to disable the /basic_status as shown below:
server {
    location = /basic_status {
        stub_status;
#       allow 127.0.0.1; #only allow requests from localhost
        deny all;       #deny all other hosts
    }
    listen 81;
}
Reload NGINX to pick up the updated config:
$ sudo nginx -t && sudo nginx -s reload
Run following command to fetch NGINX metrics from prometheus target.
$ curl http://localhost:9113/metrics
Your sample output should look as follows:
# HELP nginx_up Status of the last metric scrape
# TYPE nginx_up gauge
nginx_up 0
# HELP nginxexporter_build_info Exporter build information
# TYPE nginxexporter_build_info gauge
nginxexporter_build_info{arch="linux/amd64",commit="",date="",dirty="false",go="go1.20.1",version="0.11.0"} 1
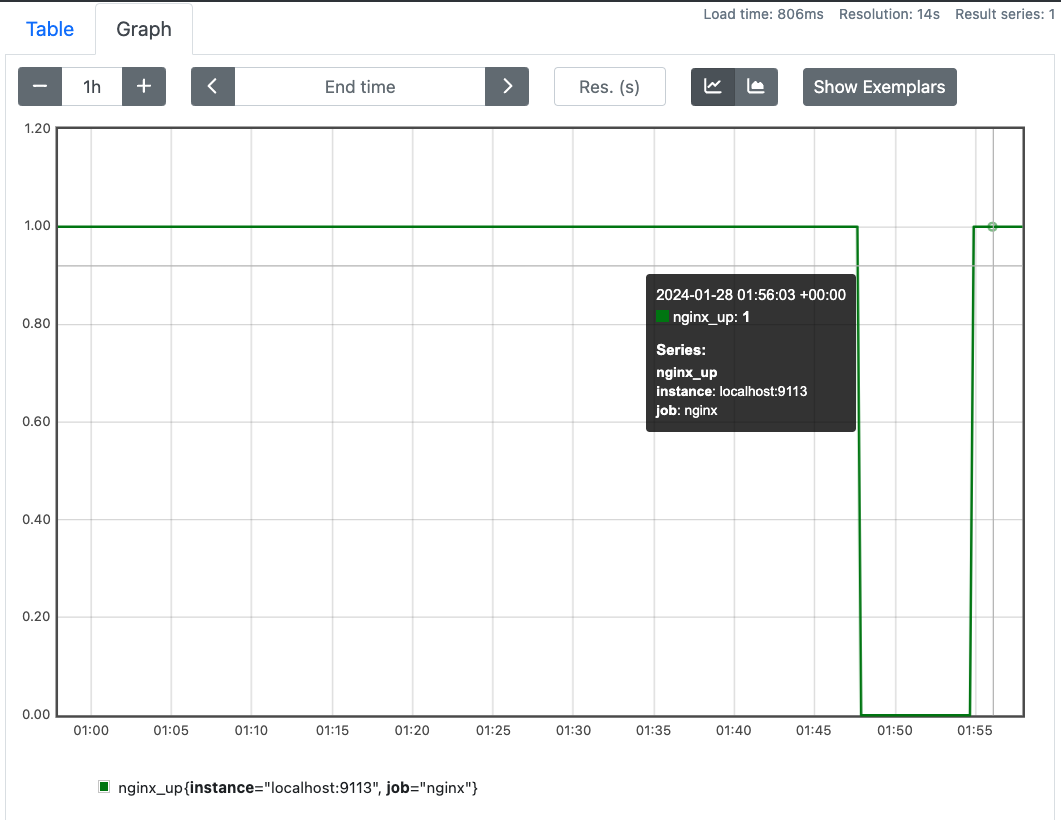
As you can see, the nginx_up metrics becomes 0. Remove the comment from your NGINX config to allow requests from localhosts again and reload the NGINX config. You'll notice that the nginx_up metric becomes 1 again. Head over to the prometheus expression browser and type following expression:
nginx_up{job="nginx"}
You should a graph of nginx_up as follows:
Create Prometheus alert rule based on nginx_up metric
Now that we have identified one way to determine if NGINX is down, let's create a prometheus alert when nginx_up metric is 0. Prometheus alerting rule allows us to define alert conditions based on Prometheus expression language. Create a rule file config named nginx_rule.yaml in the directory where you installed prometheus. Add following contents to the file:
groups:
- name: NGINX is running alert
  rules:
  - alert: NginxIsDown
    expr: nginx_up{job="nginx"} == 0
    for: 5m
    labels:
      severity: page
    annotations:
      summary: NGINX service is down
Above config tells prometheus to send an alert when nginx_up (nginx_up{job="nginx"} == 0) is 0 for 5 mins. Update your prometheus.yml to add rule_files section as follows:
# Load rules once and periodically evaluate them according to the global 'evaluation_interval'.
rule_files:
    - nginx_rule.yaml # Should alert when nginx is down
Install and configure Alertmanager
Alertmanager manages alerts triggered by Prometheus servers. It sends out notifications via email, chat platforms, and on-call notification systems. We are going to install the latest released alertmanager versions (v0.25.0) at the time of this writing. Sample commands for linux os amd64 platforms
$ wget https://github.com/prometheus/alertmanager/releases/download/v0.25.0/alertmanager-0.25.0.linux-amd64.tar.gz
$ tar -xvf alertmanager-0.25.0.linux-amd64.tar.gz
$ rm alertmanager-0.25.0.linux-amd64.tar.gz
$ cd alertmanager-0.25.0.linux-amd64/
In order to keep running alertmanager in the background without us having to manually run it, we will run it as a systemd service. Copy following systemd config and paste it to /lib/systemd/system/prometheus-alertmanager.service file.
[Unit]
Description=Prometheus alertmanager that manages alerts generated by prometheus itself, including silencing, inhibition, aggregation and sending out notifications via methods such as email, on-call notification systems, and chat platforms.
Wants=prometheus.service
After=prometheus.service

[Service]
Type=simple
ExecStart=/home/ubuntu/work/alertmanager-0.25.0.linux-amd64/alertmanager --config.file=/home/ubuntu/work/alertmanager-0.25.0.linux-amd64/alertmanager.yml --web.external-url=http://localhost:9093/alertmanager/

[Install]
WantedBy=multi-user.target
Update ExecStart to use the appropriate path where you installed alertmanager. Start prometheus-alertmanager.service as a service using following command:
$ sudo systemctl start prometheus-alertmanager.service
In order to ensure that prometheus-alertmanager service starts on reboot, enable it using the following command.
$ sudo systemctl enable prometheus-alertmanager.service
Created symlink /etc/systemd/system/multi-user.target.wants/prometheus-alertmanager.service → /lib/systemd/system/prometheus-alertmanager.service.
$
Note that we have set --web.external-url CLI of alertmanager to http://localhost:9093/alertmanager/. It tells alertmanager the endpoint it should serve HTTP requests on.
Update Prometheus Alertmanager configuration
We need to tell Prometheus the alertmanager server endpoint. Update prometheus.yml to include alerting section as follows:
# Alertmanager configuration
alerting:
  alertmanagers:
    - path_prefix: "/alertmanager"
      static_configs:
        - targets:
            - localhost:9093
Restart prometheus to pick up updated config:
$ sudo systemctl restart prometheus
Configure NGINX to act as reverse proxy to Alertmanager
Alertmanager is serving http requests on http://localhost:9093/alertmanager endpoint. Let's update NGINX to route alertmanager requests to its appropriate http server. Update NGINX config to have following config in its server stanza:
        # Act as proxy to http://<prometheus-endpoint>/graph
        location /alertmanager/ {
            proxy_pass http://localhost:9093;
            allow 12.34.56.78; #only allow requests from the source IP of your choice.
            deny all;       #deny all other hosts

            proxy_set_header        Host $host:$server_port;
            proxy_set_header        X-Real-IP $remote_addr;
            proxy_set_header        X-Forwarded-For $proxy_add_x_forwarded_for;
            proxy_set_header        X-Forwarded-Proto $scheme;

        }
Reload NGINX to pickup the updated config:
$ sudo nginx -t && sudo nginx -s reload
Configure Slack to Receive alerts from Alertmanager
In order to send notifications via Slack, Alertmanager uses Slack Incoming Webhooks to send a message when its alert rule evaluates to true (In our case, when NginxIsDown is triggered). Follow these steps to setup Slack Incoming Webhook:
Create Slack App
Head over to the Slack API site to Create your Slack App. Sign-in to your workspace to associate Slack App with it (Or create a new workspace).
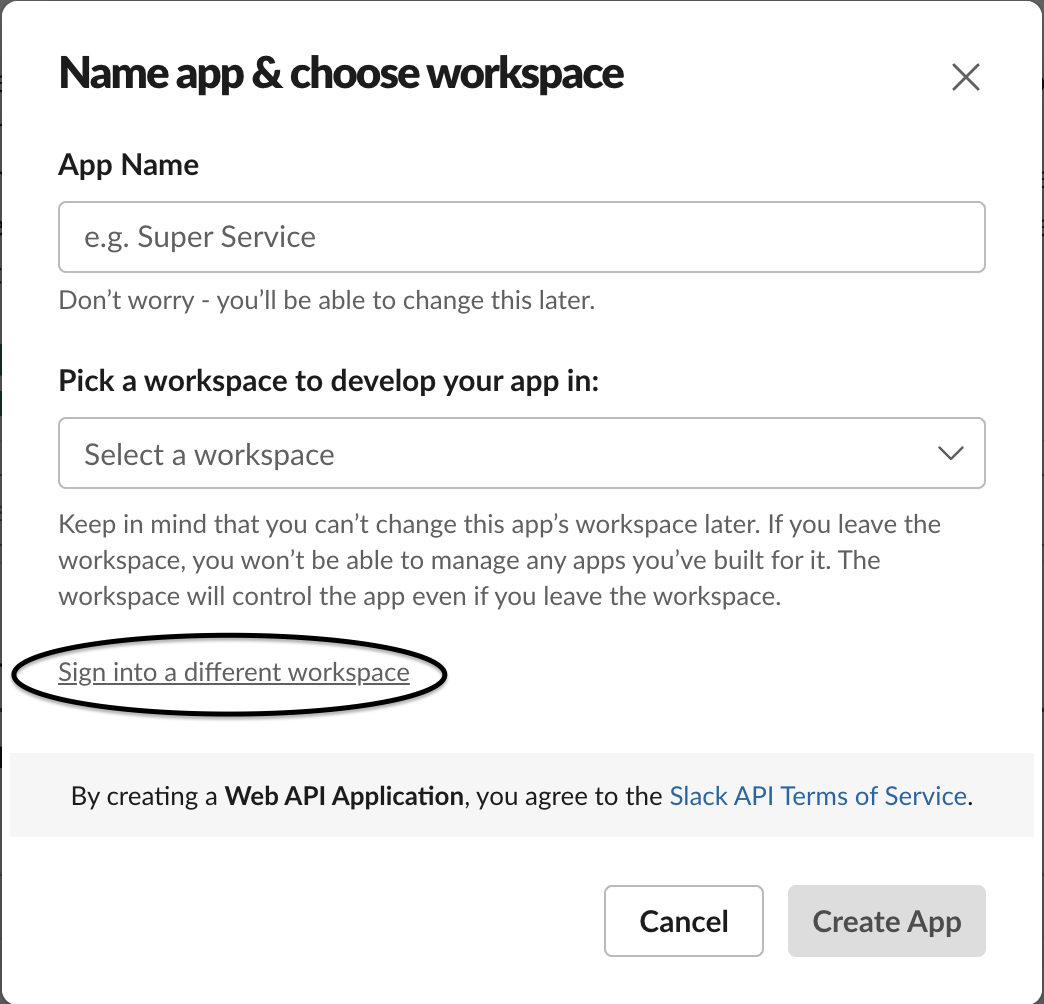 Select a name for your App Name and Pick a workspace to develop your app in from Dropdown and Click Create App button.
Enable Incoming Webhooks
Head over to the Basic Information tab of your shiny new Slack App (It should already redirect you to this tab on creation) and perform the following in order:
- Click on Incoming Webhooks.
- Turn on
Activate Incoming Webhooks - Click
Add New Webhook to Workspace - Your App needs a channel to post as an App. Select a channel in your workspace (Optionally create a new channel where you would like to receive alert messages and select it instead.) and click
Allow. This should show you a command inSample curl request to post to a channelsection.
Now your Incoming Slack Webhook should be enabled.
Test Your Webhook
The request in Sample curl request to post to a channel should look something like as follows:
curl -X POST -H 'Content-type: application/json' --data '{"text":"Hello, World!"}' https://hooks.slack.com/services/XXXXXXXXXXX/XXXXXXXXXXX/XXXXXXXXXXXXXXXXXXXXXXXX
Go ahead and execute the command in your linux shell. In the selected slack workspace and channel, you should see a Hello, World! message.
Configure Alertmanager alert config
Now that the Slack Webhook is enabled, let's configure Alertmanager to send alert messages to it. Paste following config to alertmanager.yml file in your Alertmanager directory.
global:
  slack_api_url: 'https://hooks.slack.com/services/XXXXXXXXXXX/XXXXXXXXXXX/XXXXXXXXXXXXXXXXXXXXXXXX'
route:
  receiver: "slack"
receivers:
    - name: "slack"
      slack_configs:
        - channel: "#pulleycloud-project-workspace"
Please update the slack_api_url section to use your Slack Webhook URL. Also update the channel field of receivers->slack_configs section to use the channel you want alertmanager to send alerts to. Restart
$ sudo systemctl restart prometheus-alertmanager.service
Verify the Alert Setup
As discussed in How to identify NGINX is down? section, comment out allow statement to mock NGINX being down and reload NGINX. Alertmanager should send an alert message to your selected slack workspace and channel as follows:

Have any feedback?
If you have any feedback regarding this article or need a tutorial on any specific topic, please submit this feedback form.