Install Prometheus
In the previous tutorial, we saw how to install nginx-prometheus-exporter that converts stub_status to prometheus metrics. Lets install prometheus to actually consume these metrics, and setup monitoring and alerting for NGINX status.
Download latest release of prometheus
Prometheus provides prebuilt binaries for most commonly used operating systems and architectures. We are going to follow their instructions to download and install such prebuilt prometheus on linux OS on amd64 architecture.
-
Download latest release of prometheus for linux amd64: https://prometheus.io/download/#prometheus. If you are using a different OS or architecture, please download the appropriate archive. Sample instruction to download v2.42.0 archive:
wget https://github.com/prometheus/prometheus/releases/download/v2.42.0/prometheus-2.42.0.linux-amd64.tar.gz -
Extract downloaded archive to location of your choice:
tar xvfz prometheus-2.42.0.linux-amd64.tar.gz
Install prometheus as a service
In order to keep running prometheus in the background without us having to manually run it, we will run prometheus as a systemd service. Copy following systemd config and paste it to /lib/systemd/system/prometheus.service file.
[Unit]
Description=PromServer
Wants=network-online.target
After=network-online.target

[Service]
Type=simple
ExecStart=/home/ubuntu/work/prometheus-2.42.0.linux-amd64/prometheus \
--config.file /home/ubuntu/work/prometheus-2.42.0.linux-amd64/prometheus.yml \
--storage.tsdb.path /home/ubuntu/work/prometheus-2.42.0.linux-amd64/ \
--web.external-url /prometheus/

[Install]
WantedBy=multi-user.target
Update ExecStart to use the appropriate path where you installed prometheus. Start prometheus as a service using following command:
$ sudo systemctl start prometheus.service
prometheus is running in the background. In order to ensure that the service starts on reboot, enable is using following command:
$ sudo systemctl enable prometheus
Created symlink /etc/systemd/system/multi-user.target.wants/prometheus.service → /lib/systemd/system/prometheus.service.
$
Configuring Prometheus to monitor NGINX
Prometheus imports metrics from targets by scraping metrics HTTP endpoints. Save the following basic Prometheus configuration as a file named prometheus.yml in the directory where you installed prometheus.
global:
  external_labels:
    monitor: 'pulleycloud-monitor'

scrape_configs:
  # The job name is added as a label `job=<job_name>` to any timeseries scraped from this config.
  - job_name: "nginx"

    # metrics_path defaults to '/metrics'
    # scheme defaults to 'http'.
    # This is the default -web.listen-address used by
    # https://github.com/nginxinc/nginx-prometheus-exporter
    # Service file should be located here /usr/lib/systemd/system/nginx-prometheus-exporter.service
    static_configs:
      - targets: ["localhost:9113"]
scrape_configs section of the config. Specifically, the static_configs section of a given scrape config job tells prometheus http endpoint from which metrics can be accessed. The config above tells prometheus to access NGINX config via http://localhost:9113/metrics which is served by nginx-prometheus-exporter as shown in previous tutorial.
Configure NGINX to act as reverse proxy to Prometheus
Our prometheus server is now running as service and is actively importing NGINX metrics. But how do we actually see those metrics as graph? The answer is prometheus's expression browser. Lets update our NIGNX configuration so it acts as a reverse proxy to prometheus server. This will allow us to access the expression browser from a device other than the EC2 instance itself.
In the previous tutorial, we updated NGINX to serve MkDocs site contents. We will update the same server stanza to include following config:
        # Act as proxy to http://<prometheus-endpoint>/graph
        location /prometheus/ {
                proxy_pass http://localhost:9090/prometheus/;
                allow 12.34.56.78; #only allow requests from source IP of your choice
                deny all;       #deny all other hosts

                proxy_set_header        Host $host:$server_port;
                proxy_set_header        X-Real-IP $remote_addr;
                proxy_set_header        X-Forwarded-For $proxy_add_x_forwarded_for;
                proxy_set_header        X-Forwarded-Proto $scheme;


        }
Above config tells NGINX to route https://<your_domain>/prometheus/* requests to http://localhost:9090/prometheus/*. In the previous section where we defined service config for prometheus, we defined --web.external-url /prometheus/ in the ExecStart variable. That tells prometheus the URL using which prometheus will be accessed externally (Reference). The combination of allow and deny option above allows /prometheus/ to be accessible only from 12.34.56.78 IP address. Please update that to be the IP address where you will be accessing prometheus from. Reload the NGINX to pick up updated config file:
$ sudo nginx -t && sudo nginx -s reload
Now open your browser on IP which is allowed by NGINX, and access following URL:
https://<your domain>/prometheus/graph
That should show prometheus expression browser as follows:
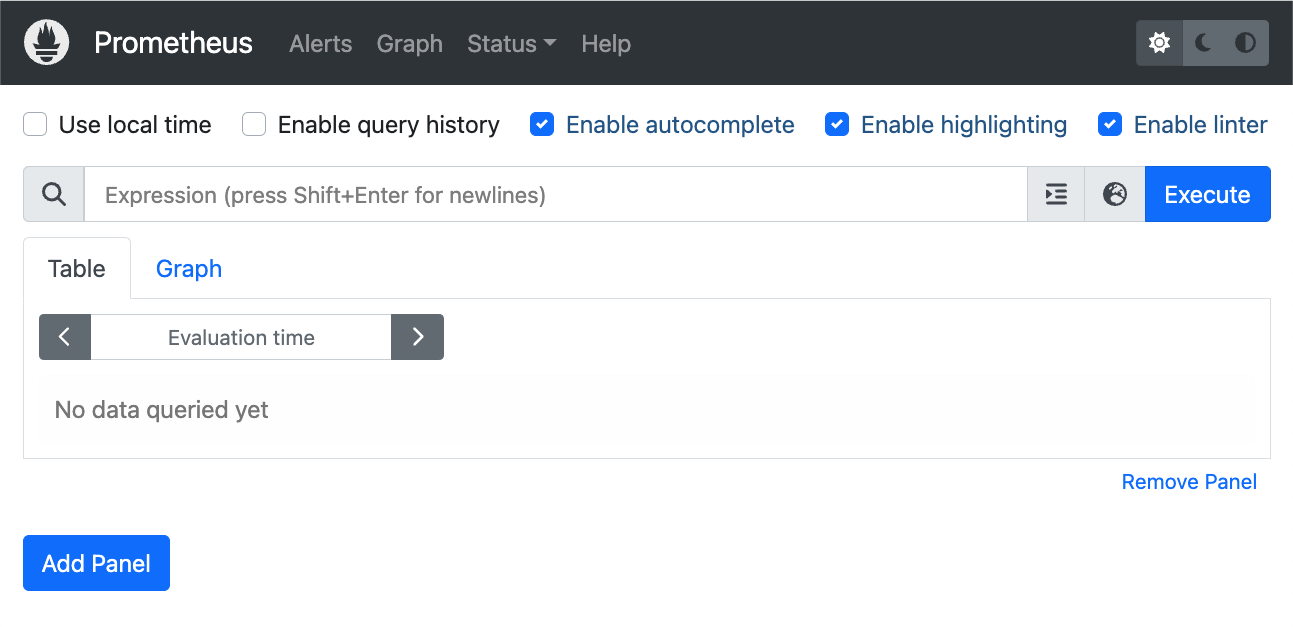
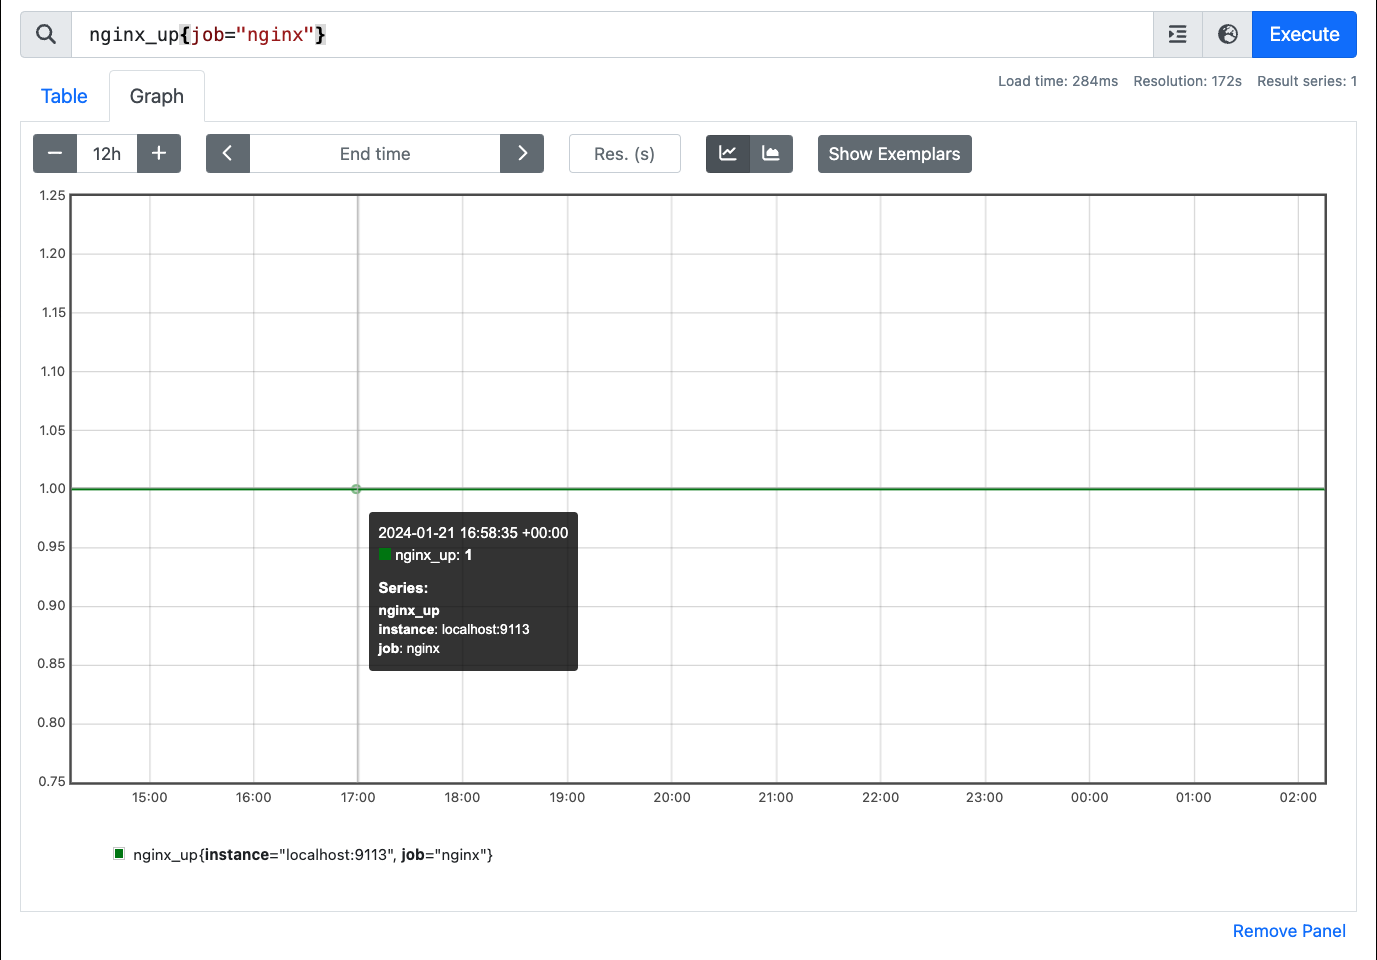
In the Expression search bar, enter following expression:
nginx_up{job="nginx"}
You should be able to see graph with metrics as follows:
Now that nginx metrics are being actively imported by prometheus, we are going to setup alerts on these metrics in the next tutorial.
Have any feedback?
If you have any feedback regarding this article or need a tutorial on any specific topic, please submit this feedback form.